I've seen this issue come up in other pages but none of their solutions worked for me.
import plotly.express as px
import geopandas as gpd
import cartopy.crs as ccrs

regions = gpd.read_file("SA4_2021_AUST_GDA2020.shp").to_crs(ccrs.PlateCarree()).loc[lambda x: x["STE_NAME21"]=="Victoria"].reset_index(drop=True)
fig = px.choropleth(regions,
                   geojson=regions["geometry"],
                   locations=regions.index,
                   color="SA4_NAME21")

fig.update_geos(fitbounds="locations", visible=False)
fig.show()
The shape file can be found here - Shapefile site, I used the Statistical areas level 4 file.
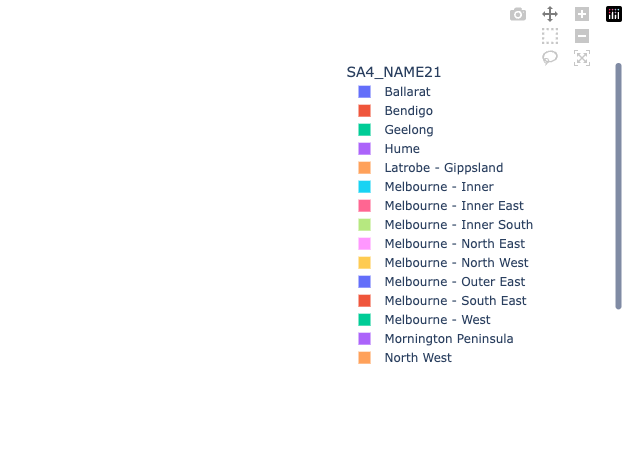
The resulting plot is completely blank save for the legend. I've tried a number of different coordinate systems columns for the color column and nothing works. -